


What Factors Influence Lithium Battery Charge and Discharge Efficiency?
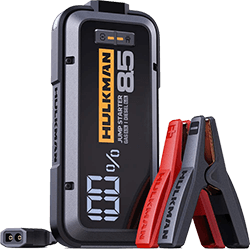
Lithium batteries are ubiquitous—from smartphones and laptops to power stations and electric vehicles. But in real-world conditions, they rarely reach ideal efficiency. Understanding what drags down their charge/discharge efficiency is key to designing better systems, especially in premium devices like Hulkman Mega Power Station.
In this article, we’ll cover:
- What Influences Lithium Battery Charge Efficiency?
- What Influences Lithium Battery Discharge Efficiency?
- Practical Takeaways for Users and Designers
What Influences Lithium Battery Charge Efficiency?
Temperature Effects: The Single Most Critical Factor
Low Temperature (< 5 °C)
At low temperatures, ions in the electrolyte move sluggishly, internal resistance rises, and polarization becomes severe. Many BMS controllers forcibly reduce charging current to 0.2 C or less and require a pre-warming phase before full charging.
Academic insight: In low-temperature environments, polarization & resistance components (ohmic, concentration) dominate, sharply degrading capacity and efficiency. (MDPI)
Another review identifies reduced ionic conductivity, sluggish interfacial kinetics, and increased desolvation energy as major causes of performance drop at low temperature. (pubs.rsc.org)
In practice, many EV owners report that battery range contracts by 20–40 % in subzero conditions.
High Temperature (> 45 °C)
Heat accelerates side reactions and degrades cell structure. Every 10 °C increase roughly doubles the rate of parasitic reactions, leading to gas formation, swelling, or oxygen release. Hence, under load, BMS systems usually reduce charging current proactively.
Cell Temperature Imbalance (> 5 °C)
Within a battery pack, if one cell is hotter or colder by >5 °C than neighbors, the BMS may prematurely swap to constant voltage mode or reduce current, shortening the fast-charging window.
Current / C-rate Effects: Too Fast, Too Risky
Charging or Discharging > 1 C: When currents exceed ~1 C, polarization effects amplify. Voltage deviates from ideal (electrode potentials shift), due to slow ion/ electron transport relative to applied current. In charging, the anode potential may drop below 0 V vs Li, triggering lithium plating (dead lithium). In discharging, positive electrode potentials may exceed safe thresholds, causing side reactions.
In essence, pushing more current than the battery's internal chemistry can support is like forcing traffic through a clogged road: congestion and inefficiency emerge.
Wiring and Contact Resistance: If wiring or connectors introduce voltage drops >100 mV, charger systems may derate current or extend charging time. For example, poor contact in DC or high-current connectors leads to energy loss and the charger might throttle current to stay within safe thresholds.
Voltage-Related Constraints
Deep Overdischarge (< 2 V): When cells fall below ~2 V, BMS logic must use low-current trickle charging (e.g. 0.1 C) to “wake up” the battery gently. This startup can take 10–30 minutes, making initial charging feel painfully slow.
Excessive Cutoff Voltage (> 4.2 V for NCM-type cells): In NCM chemistry which Hulkman power station equipped, overcharging beyond ~4.20 V risks oxygen release and structural degradation. The last 1 % of charge only raises cell voltage by ~0.03 V. To detect that safely, the BMS must reduce current drastically, often down from 1 C to as low as 0.05 C, to let internal voltages settle and avoid overshoot.
Cell Imbalance (> 10 mV in LFP packs): LFP chemistry is challenging because voltage is nearly flat over most of SOC. If one cell drifts 10 mV ahead, BMS must curtail current and actively balance (shunt energy away). Because balancing is slow, the final 5–10 % of charging often drags.
Aging Effects & Internal Degradation
Internal Resistance (DCIR) Increase: As a battery ages, its internal resistance rises (due to SEI thickening, electrode degradation, particle fracture). With higher resistance, the same charge current leads to greater voltage drops (polarization), forcing the controller to shorten the constant-current phase by 15–30 %.
Lithium Plating & Cracks: Over time, repeated stress can create microcracks or block diffusion paths. Lithium plating becomes more likely, diffusion slows, and the CV phase (tail-end charging) lengthens.
System-Level Constraints
Cooling Failure: If the pack’s cooling fails (fan stops, pump malfunctions), internal temperature may rise >1 °C/min. The BMS will step down current or cut charging entirely to protect cells.
Source / Infrastructure Limits: In many grids, power or cable infrastructure may not support full charging currents. Voltage sag or supply limits force hardware-level derating. For example, a 3 kW charger may throttle to 2 kW on weak grid nodes or with thin wires.
What Influences Lithium Battery Discharge Efficiency?
When a lithium battery powers a device, its efficiency isn’t simply a function of capacity. Many layered factors—from connector type to system cooling—play a role. Broadly, we can classify them into four categories: Connector / Port Type, Link / Wiring Losses, Battery Intrinsic Factors, System-Level Constraints.
Together, these determine whether your “fast discharge” behaves as intended or gets throttled in real use. Below is a deeper dive into each category and how they manifest in real-world use.
Connector / Port Type
The interface between the battery and the load plays a foundational role:
DC ports: The diameter of the cable and the connector type matter. When the load exceeds ~240 W, using undersized DC leads or poor connectors forces derating—or requires higher-grade connectors like Anderson or XT90.
USB-A: Uses a 5 V buck-converter chip; efficiency and heat losses depend heavily on the quality of that chip.
USB-C PD / bi-directional buck-boost: Excellent for ≤100 W loads. But once load demands go higher, the system must switch to AC (inversion) to maintain efficiency.
AC output (inverter): Efficiency losses associated with inversion are factored here; but for loads over ~100 W, AC is often the more efficient path.
Link / Wiring Losses
Even perfect batteries and ports suffer in real systems because of wiring and contact losses:
Voltage drop in wiring or connectors: In a well-designed system, resistance is in the milli-ohm range, giving negligible loss. But poor cables or contactors might let 100 W fall to 15 W of usable power.
Contact resistance growth: After many plug/unplug cycles (e.g. 500 times), contact resistance may triple. This leads to higher voltage drop and a measurable efficiency loss (e.g. ~1%).
Forum users note that “USB ports seem to fade in power output over time”—some report the voltage falling from 5.1 V to ~4.8 V, meaning reduced current and slower charging. (All About Circuits)
Temperature rise at contact or in connector housing: A plastic USB-C shell may rise ~20 °C under load, whereas metal shells might only rise ~8 °C. That thermal stress can cause drop in converter efficiency, forcing power limits.
Battery-Intrinsic Factors
These factors stem from the battery’s internal condition, chemistry, and state:
Low temperature (<5 °C): Internal resistance increases, and the overall link efficiency may drop by 2–3%. The USB-C controller itself may force a lower current draw.
DCIR (internal resistance) doubling: Older or degraded batteries exhibit higher instantaneous voltage drops under load. This reduces headroom, forcing the system to derate performance. A 0.1 V drop may translate to a 30% performance loss.
Cell imbalance (>10 mV difference, especially in LFP): The BMS may reduce output early to avoid overdischarging/overvoltage on individual cells. That can temporarily reduce available current output by 2% or more.
System-Level Constraints
No matter how ideal the battery or wiring is, system-level issues often determine whether full power can flow:
Cooling failure: If the thermal system fails and heat rises (e.g. connector or PCB heats by +20 °C), the BMS may de-rate 5% or more to protect components.
Low state-of-charge (SOC): Many BMS designs reduce current limits when SOC falls below ~20%. For instance, a 100 W USB-C port may get cut to 50 W, which is perceived by users as “slow charging.”
Practical Takeaways for Users & Designers
For loads over 100 W, always prefer AC output rather than USB-C, unless your system is built for high USB-C power.
Use high-quality cables and connectors, minimize contact resistance, and monitor for connector wear.
Design BMS systems to account for temperature drift, SOC limits, and cell imbalance.
Build redundant cooling and fallback derating logic so that efficiency only drops gracefully under unfavorable conditions.
By understanding these four domains—connector design, wiring losses, battery internals, and systemic constraints—engineers can optimize real-world performance, not just ideal specs.
Learn more and use exclusive coed “TNZG4NC7” to get hidden Mega discount at checkout.